Full presentation
GLUE · 34 slides
Loading presentation…
This note follows my presentation on Cao and Gao, Multi-omics single-cell data integration and regulatory inference with graph-linked embedding (Nature Biotechnology, 2022).
1. The unpaired integration problem
Different assays observe different aspects of a cell. scRNA-seq measures gene expression, scATAC-seq measures chromatin accessibility, and single-cell methylation assays measure DNA methylation.
When these assays are performed on different cells, neither the rows nor the columns necessarily match:
| Assay | Rows | Features |
|---|---|---|
| scRNA-seq | RNA-profiled cells | Genes |
| scATAC-seq | ATAC-profiled cells | Peaks |
| Methylation assay | Methylation-profiled cells | Genomic regions |
This is often called diagonal integration. We cannot simply concatenate the matrices by cell or compare corresponding columns. The goal is to construct a shared representation while retaining meaningful biological differences.
GLUE stands for graph-linked unified embedding. Its defining idea is to connect the feature spaces through a knowledge-based graph, while learning cell embeddings from each assay.
2. Two representations: cells and features
For modality $m$, let $X_m$ have $n_m$ cells and $p_m$ features. An intuitive factorization is
\[X_m\approx U_mV_m^\mathsf T, \qquad U_m\in\mathbb R^{n_m\times d}, \quad V_m\in\mathbb R^{p_m\times d}.\]Here, $U_m$ represents cells and $V_m$ represents features in a latent space of dimension $d$. This expression explains the role of the embeddings; GLUE uses probabilistic encoders and modality-specific generative decoders rather than fitting only a least-squares matrix product.
The distinction is useful:
- Cell embeddings support cell matching, visualization, and annotation.
- Feature embeddings support cross-assay regulatory comparisons.
Reconstructing each modality separately is insufficient. The latent coordinates could be rotated or organized differently, even if reconstruction within each assay were good.
3. The guidance graph
The guidance graph supplies candidate relationships between features. A peak near a gene, for example, can be connected to that gene based on prior regulatory knowledge. The graph describes relationships among features, not a list of known cell-to-cell matches.
A graph encoder learns feature embeddings that help reconstruct this graph. Those same feature embeddings participate in reconstructing the observed omics data. The graph therefore connects the otherwise separate feature spaces.
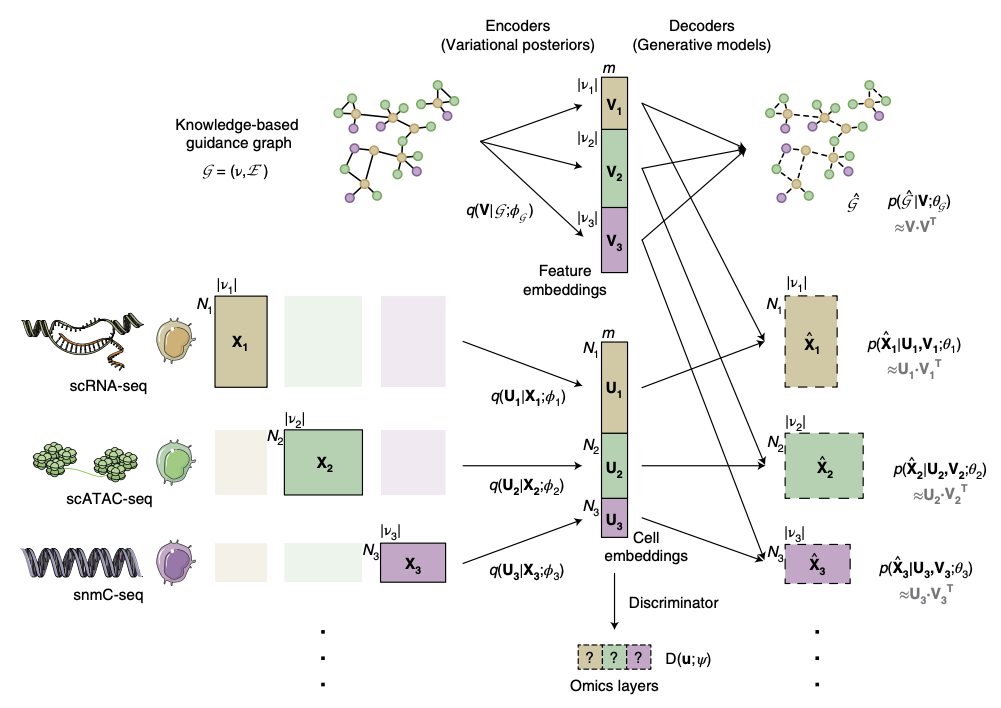 Architecture reproduced from my presentation, slide 5; original source: Cao and Gao (2022).
This is a way to combine prior relationships with data. A guidance edge is still a hypothesis, and a learned regulatory score is not a calibrated posterior probability of causality.
4. Adversarial alignment
GLUE also trains a discriminator to identify the omics modality from a cell embedding. The cell encoders are trained against that discriminator, encouraging representations that are difficult to distinguish by assay.
The presentation uses a GAN analogy: one model learns to discriminate, while another learns a representation that defeats it. Here, the goal is alignment of biological representations.
Three requirements act together:
- Cells should retain enough information to reconstruct their own assay.
- Features should respect information in the guidance graph.
- Cell embeddings should align across assays.
Perfect mixing alone would be a poor objective. If unrelated cell types were forced together, the modalities would look well mixed while the biology was lost.
5. What the integrated space enables
The presentation discusses integrating RNA, accessibility, and methylation data. Neighbors in the shared latent space can support label transfer between assays. Agreement can then be assessed through marker overlap and relationships among the different molecular measurements.
It is important to distinguish matching cellular states from identifying the exact same physical cell. In an unpaired experiment, there is generally no observed one-to-one ground truth.
Feature embeddings provide another output. For a peak $p$ and gene $g$, a regulatory score can be based on cosine similarity:
\[s_{pg} =\frac{v_p^\mathsf T v_g}{\lVert v_p\rVert\,\lVert v_g\rVert}.\]The score summarizes alignment in the learned feature space. The presentation compares these scores with external regulatory evidence and discusses examples involving NCF2 and CD83. Such comparisons help evaluate whether the embedding captures useful relationships beyond proximity alone.
6. Evaluating integration
The benchmark distinguishes two objectives:
| Objective | Question | Examples in the presentation |
|---|---|---|
| Omics mixing | Do comparable cells from different assays align? | Same-modality neighbor score, modality silhouette, graph connectivity |
| Biological conservation | Are meaningful biological neighborhoods retained? | Cell-type silhouette, mean average precision, neighbor consistency |
The presentation reports an overall score combining mixing and biological conservation with weights 0.4 and 0.6. This is a benchmark convention, not a universal definition of integration quality.
For paired evaluation data, FOSCTTM asks what fraction of candidates are closer to a cell than its known true partner. Lower values indicate better matching. This metric requires known matches and cannot directly validate every unpaired dataset.
Scalability is also part of the evaluation: a method may produce useful embeddings on a small benchmark but become impractical on much larger atlases.
7. Interpretation and limitations
The appeal of GLUE is that it connects cell alignment with a feature-level regulatory representation. Its architecture is more complicated than a single factor model, so understanding each component’s role is more useful than treating the entire system as a black box.
A practical review should ask whether the assays share comparable cell populations, whether the guidance graph is appropriate, and whether batch or condition is confounded with modality. A visually mixed UMAP cannot answer these questions by itself.
Regulatory scores are candidates for follow-up, not proof of direct regulation. Independent assays and perturbations remain valuable for testing their biological interpretation.
For additive gene programs, see cNMF and V2G2P. For the role of integration within an analysis pipeline, see Techniques of scRNA-seq.
References
- Presentation source:
02.GLUE.pptx, slides 1–34. - Cao and Gao (2022). Multi-omics single-cell data integration and regulatory inference with graph-linked embedding. Nature Biotechnology.