Full presentation
cNMF and V2G2P · 57 slides
Loading presentation…
This note follows my cNMF presentation on Schnitzler et al., Convergence of coronary artery disease genes onto endothelial cell programs (Nature, 2024). The paper uses consensus non-negative matrix factorization as one part of a larger Variant-to-Gene-to-Program (V2G2P) strategy.
1. Why move from genes to programs?
GWAS identifies genomic loci associated with a trait, but a locus is not yet a biological mechanism. A noncoding variant may influence a distant gene, and several genes at different loci may influence the same cellular process.
The question in this paper is whether genes implicated in coronary artery disease (CAD) converge on common programs in endothelial cells. The study uses telomerase-immortalized human aortic endothelial cells, or teloHAECs, as an experimental model.
A gene expression program describes a coordinated pattern across multiple genes. A cell can simultaneously express programs related to its identity, cell cycle, stress response, and environmental signals. This is why assigning each cell to one cluster does not fully describe its state.
The study connects four levels:
CAD-associated variant → candidate target gene → endothelial program → disease-relevant cellular function.
2. Variant-to-gene links and the ABC model
The presentation starts with 228 non-lipid CAD association signals. Nearby genes provide candidate targets, while regulatory evidence helps prioritize links. Proximity is useful for generating candidates, but the nearest gene need not be the functional target.
The Activity-by-Contact (ABC) model combines enhancer activity with contact between the enhancer and a target promoter. A simplified score for enhancer $e$ and gene $g$ is
\[\operatorname{ABC}_{eg} =\frac{A_e C_{eg}}{\sum_{e'\in\mathcal E_g}A_{e'}C_{e'g}}.\]Here, $A_e$ represents enhancer activity, $C_{eg}$ represents contact, and $\mathcal E_g$ is the set of candidate elements for the gene. Contact should not be interpreted simply as genomic distance, although distance can inform its estimation.
For the illustrative products $2,8,15,12,5$ in the slides, the denominator is 42. The resulting scores are approximately $0.048,0.190,0.357,0.286,0.119$. These are relative scores within the candidate set, not probabilities that a gene causes CAD.
The V2G map described in the presentation links 125 CAD signals to 254 genes. These prioritized links are distinct from the broader gene set used in the perturbation experiment.
3. Gene-to-program links with Perturb-seq
CRISPR interference suppresses the activity of targeted genes. Single-cell RNA sequencing then measures the transcriptional consequences in individual cells. The presentation describes an experiment containing 214,449 cells.
The experiment yields two kinds of information:
| Information | Biological question |
|---|---|
| Cell-by-gene expression matrix | Which transcriptional states are present? |
| Perturbation identity for each cell | Which targeted genes change those states? |
Rather than test and interpret every gene separately, the study compresses the expression matrix into program activities. It then tests how each perturbation changes those activities.
4. NMF: usage and gene weights
Let $X$ be a nonnegative matrix with $n$ cells and $p$ genes. Non-negative matrix factorization approximates it as
\[X_{n\times p}\approx U_{n\times K}V_{K\times p}, \qquad U_{ik}\geq0,\quad V_{kg}\geq0.\]The two factors have different interpretations:
- Usage $U_{ik}$: the contribution of program $k$ to cell $i$.
- Gene weight $V_{kg}$: the contribution of gene $g$ to program $k$.
Thus, a cell is represented as an additive combination of programs. Unlike PCA, NMF does not use negative weights to cancel positive contributions. This can make programs easier to interpret, but nonnegativity alone does not guarantee sparse weights or biological validity.
The factor-analysis examples in the presentation help distinguish cell scores from feature loadings. NMF is a constrained matrix factorization; it is not identical to a classical probabilistic factor-analysis model, and its weights are not automatically correlations.
Why consensus?
NMF solutions can change with random initialization. cNMF repeats the factorization, removes outlier components, groups similar components across runs, and obtains consensus programs. It then estimates cell usage with the consensus programs fixed. The component count must balance reconstruction and reproducibility; it is not a known biological constant. See Kotliar et al. (2019).
The CAD study selected $K=60$ for downstream analysis. Its illustrated catalog contains 50 annotated gene programs; the number of fitted components and the number of biologically annotated programs should not be conflated.
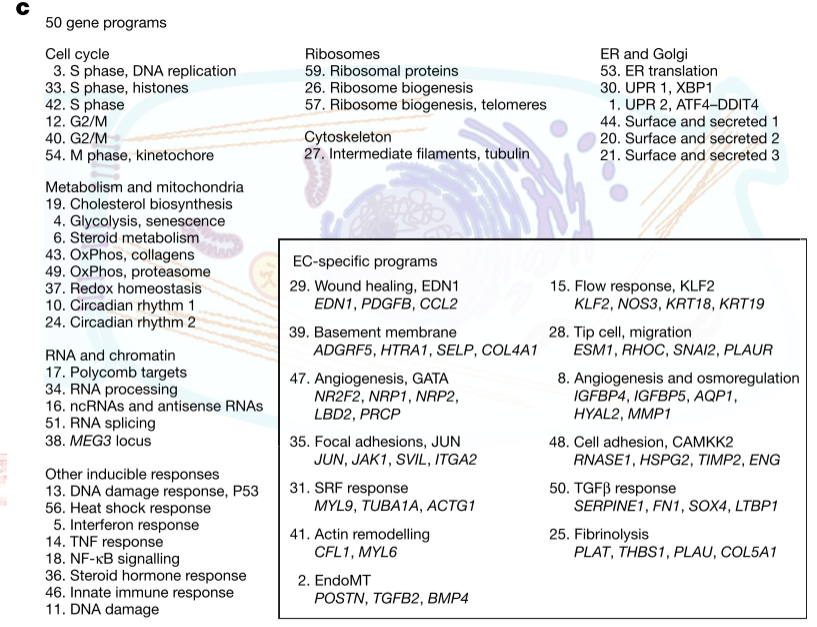 Program catalog reproduced from my presentation, slide 5; original figure: Schnitzler et al. (2024), Fig. 1c.
5. Program genes are different from program regulators
High-weight genes help describe what a program does. Perturbations that alter program usage identify potential regulators of that program. A regulator does not have to be one of the genes with the highest expression weight.
The presentation describes selecting 300 co-regulated genes per program, testing perturbation effects, and annotating programs with gene sets, transcription-factor motifs, and manual interpretation. Thirteen programs were identified as endothelial-cell-specific.
V2G provides disease-associated candidate genes. G2P provides links between perturbed genes and programs. Combining the maps allows enrichment testing of whether CAD-linked genes regulate particular programs. The study identifies five CAD-associated programs, supported by additional genetic analyses.
This distinction matters: a program discovered from expression is not automatically a disease program. The disease association enters through additional evidence.
6. CCM2 and TLNRD1
The presentation then follows two regulators, CCM2 and TLNRD1. CCM2 is already associated with the cerebral cavernous malformation pathway, whereas the endothelial role of TLNRD1 was less well characterized.
The study assembles evidence at several levels: similar transcriptional responses to perturbation, protein-interaction evidence, pathway experiments, vascular phenotypes in zebrafish, and endothelial barrier measurements. Together these connect TLNRD1 to CCM signaling and CAD-associated programs.
The direction of an effect must remain tied to its experimental context. A favorable barrier phenotype in cultured aortic endothelial cells does not mean that loss of the same gene is universally beneficial across tissues. Likewise, an associated allele, a CRISPRi perturbation, and a complete knockout are different interventions.
7. What this study illustrates
The contribution is the connection between statistical structure and experimental mechanism. cNMF produces interpretable summaries of expression, Perturb-seq links interventions to those summaries, and genetic evidence identifies which programs may matter for CAD.
Each link has its own uncertainty. ABC links are predictions, factorization depends on preprocessing and component choice, and program enrichment does not establish that every linked gene is causal. Functional experiments make the interpretation more persuasive.
For the broader analysis workflow, see Techniques of scRNA-seq. For comparisons across biological samples, see muscat.
References
- Presentation source:
01.cNMF.pptx, slides 1–57. - Schnitzler et al. (2024). Convergence of coronary artery disease genes onto endothelial cell programs. Nature.
- Kotliar et al. (2019). Identifying gene expression programs of cell-type identity and cellular activity with single-cell RNA-Seq. eLife.